Description
Voice Sonogram
![]()
"Voice Sonogram" is sound spectrogram app that expresses color intensity by frequency analysis of temporally continuous sounds. The sound spectrogram is used for acoustic analysis and voiceprint appraisal.
This app uses some sound analysis techniques such as FFT and Wavelet transform, and graphs the analysis results. It can be easily analyzed voices and instrument sounds, or you can learn elementary sound analysis.
For customers using "Voice Sonogram" app : Updated for iOS14.
Products Information
- Version: 1.1
- Release date: September 20, 2020
- Size: 2.7 MB
- Category: Education, Music
- Compatibility: Compatible with iPhone. Requires iOS 13.6 or later.
- Status: Unsubscribe
Features
"Voice Sonogram" has the following features:
- Analyze the sound data recorded from the built-in microphone.
- FFT, Octave band analysis, and Wavelet transform can be selected.
- Analysis result graph and time axis sound waveform can be compared in playback.
- Snapshot: Save the analysis result in Photos.
Specification
- Sampling frequency: 48kHz
- Recording time: Approximately 3 seconds
- Discrete Fourier transform: FFT (2048 points)
- Octave band analysis: 1/48 octave band
- Wavelet transform: Gabor Wavelet
- Graph display: vertical axis - time (0 - 3.0 sec), horizontal axis - frequency (100Hz - 8000Hz)
Applications
- Visualization analysis of the sound source, such as voice, conversation, animal sounds and instrument sounds.
- Analysis of the sound configuration, such as music performance.
- Learning elementary sound analysis
- Various acoustic testing and others.
Spectrogram
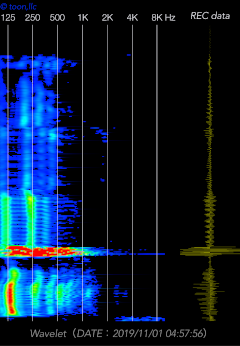
The spectrogram is a graphical image with two geometric dimensions that the horizontal axis represents time and the vertical axis is frequency, and the addtional third dimension is indicating the amplitude of a particular frequency at a particular time that is represented by colour of each point in the image.
- Measurement display X-axis - time(sec)
- Measurement display Y-axis - frequency(Hz)
- Measurement display color image - signal's amplitude
Basic Operations
The access permission to the microphone will be confirmed from the iOS system at the first start-up. Please enable access to the microphone.
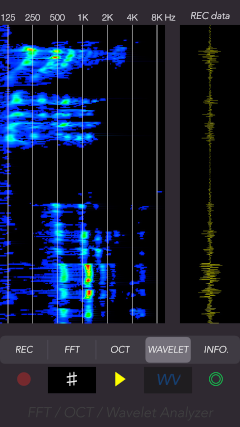
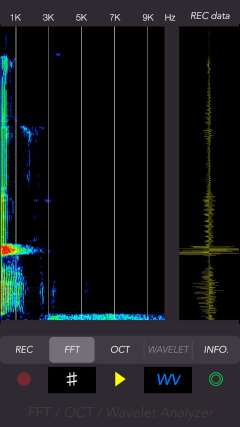
The top view includes the mode selections and the control buttons and the trace display. The mode have 5 types of REC, FFT, OCT, WAVELET and INFO. The control buttons are Recording (red circle icon), Graph scale display (#), Replay (triangle icon), Wavelet transform (WV), and Snapshot (double circle icon), in order from the lower left.
As a basic operation, first select the REC mode, tap the record button and record the sound, and the sound analysis (FFT and octave band analysis) will be performed automatically.
Furthermore, if wavelet analysis is required, tap "WV" button to perform Wavelet conversion processing.
Tap the mode button to switch between the trace display by the acoustic analysis method.
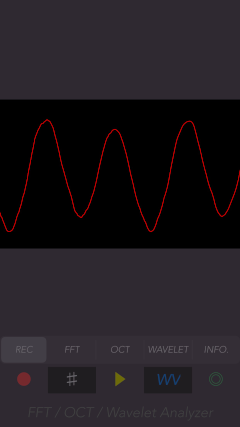
- Recording: Record the target sound you want to analyze with the built-in microphone.
- When tap the record button, sound recording (about 3 seconds) starts and is temporarily saved as sound recording data. After recording, FFT and Octave band analysis are performed. When this calculation process is completed, it switches to FFT mode and the analysis results are displayed.
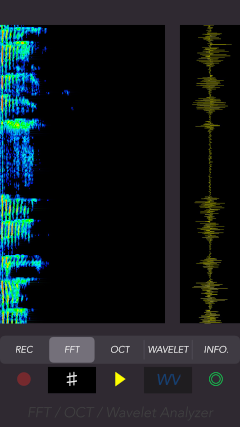
- FFT: Displays the sound spectrogram by FFT analysis.
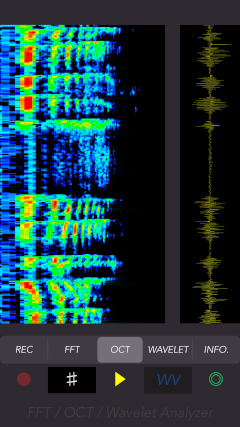
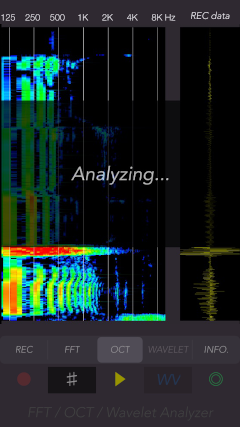
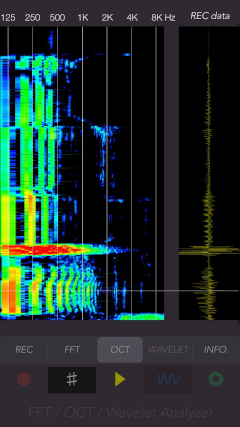
- OCT: Displays the spectrogram of the octave band analysis results.
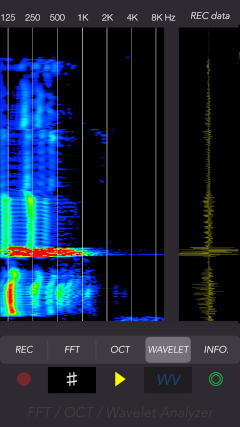
It is the analysis result of frequency division into 1/48 octave bands based on the frequency component data obtained by FFT. - WAVELET: Displays sound spectrogram by wavelet analysis.
Tap “WV” button to start wavelet analysis. This computation process takes a little processing time, and it depends on the terminal model. When this operation is complete, it displayes the spectrogram of the wavelet analysis results. - Replay: Sound playback is performed and the sound waveform and acoustic analysis results are displayed simultaneously. The current playback position is indicated by the cursor.
- Graph scale: Tap “#” button to turn on/off the graph scale on the trace display.
- Version 1.1 was released on September 20, 2020.
- Version 1.0 was released on October 24, 2019.
- At the time of the first access to microphone and photos after installing the app, you will be asked permission to access them from the iOS. If you did not enable this setting on this time, it can not be access from the app by privacy restrictions of the iOS. Please enable slide switch of the app in the access permission of the iOS setting, "Settings > Privacy > Photos or Microphone".
- Wavelet transform has a large amount of calculation, so the processing load may be depending on the iPhone model, and it may take time to display the analysis result.

Snapshot
Snapshot captures the trace display as a still image.
Tap Snapshot button, the trace display image is saved PNG file format to Photos. A time stamp is inserted into the image. File name is IMG_xxxx.png.
At the first use, the confirmation of access to Photos is required once on iOS system.
Information view
By tapping INFO button, it is displayed the product information and usages.