Description
Vibroscope - Vibration Measurement and Analysis Tools
![]()
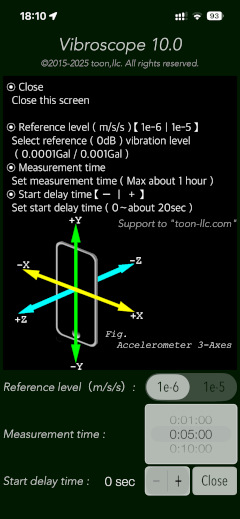
"Vibroscope" is a vibration measurement and analysis tools by using the iPhone's acceleration sensor in real time. It allows you to monitor by visualizing the low-frequency vibration, such as inaudible by ear.
This app can be intuitively detected an acceleration amount, that displays the two-axial coordinates in the horizontal direction and the time-axis waveform in the vertical direction. It can measure by determining the horizontal or vertical direction to suit the attitude of the iPhone automatically, so as to be available on the floor and desk or handheld.
"Vibroscope" is also equipped with the ability to analyze the frequency components of the low frequency vibration by the FFT analyzer.
Also, the "GAL" unit of earthquake acceleration can be converted by multiplying the 100 in this app's measurement display value.
If a detailed sound level analysis is required, it is recommended that you use our iPhone sound level measuring and analysis app "Sound Level Analyzer".
Please to click the link below to visit the product page on AppStoreTM.
![]()
- Communications charges when connecting to AppStore will be borne by the customer.
- iPhone is a trademark of Apple Inc. registered in the U.S. and other countries. AppStore is a service mark of Apple Inc.
Products Information
- Version: 10.0
- Release date: November 19, 2025. UTC
- Size: 0.8 MB
- Category: Utilities, Life style
- Compatibility: Compatible with iPhone. Requires iOS 18.7 or later.
- Status: Now distributing.
Features
- Optimized for iPhone, Compact code size.
- Measurement of vibrations (Main): acceleration values [m/s2]
- Real-time display: the horizontal direction - the two-axial vector plane graph, the vertical direction - the time-axis waveform.
- 3-axis composite acceleration display (Compo): Compo.[m/s2] (orange-line on the time-axis waveform).
- Linear scale graph display. (Linear)
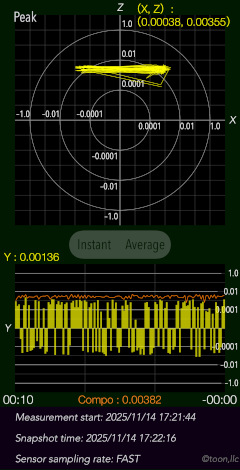
- Peak level display. (Peak)
- Display of the peak acceleration level along X, Y, Z, 3-axis composition.
- Switching of the sensor sampling period: Fast, Slow.
- Axis direction (Axis): Swapping the axis direction on the graph display during operation.
- Switching of acceleration display (Instant/Average): Instant - instantaneous acceleration, Average - average acceleration per second.
- Logarithmic scale graph display (Log)
- Time setting of Measurement timer duration: 1 sec - 1 hour.
- Time setting of Start delay timer: 0 - 20 sec.
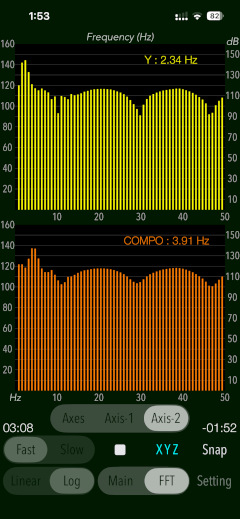
- FFT analysis for 3-axis directional and composite acceleration (FFT)
- Peak Frequency display function on FFT mode.
- Reference level setting in FFT mode: 1e-6m/s/s, or 1e-5m/s/s.
- Snapshot of the measurement screen: Capture the measurement results and Time-stamp to "Photos"
- Logging Function: X-axis, Y-axis, Z-axis, saved in a text file (UTF8) . It saves the measurement data, Time-stamp to LOG file. It can be exported by using iPhone file sharing.
Applications
"Vibroscope" can be used in applications such as the following utilization examples:
- In cases such as car traffic, to analyze the vibration and frequency components on the floor and walls.
- To measure the howling level such as Audio equipment.
- To detect the vibration and acceleration of train or automobile.
- Check the sense of balance by the sensing of the horizontal direction of the body swinging.
Operational Mode
"Vibroscope" has two operational modes, MAIN and FFT. By tapping each button, its operation mode is selected and executed.
- MAIN : Vibration level measurement mode (default)
- FFT : FFT analyzer mode
MAIN mode
This mode makes the vibration measurement in general.
By tapping Start button to start the vibration level measurement, and it then stop by tapping Stop button.

The display speed will be changed in the display speed button (FAST, SLOW). Measurement display will be able to shift the display range by up-down button ( [+] or [-] ).
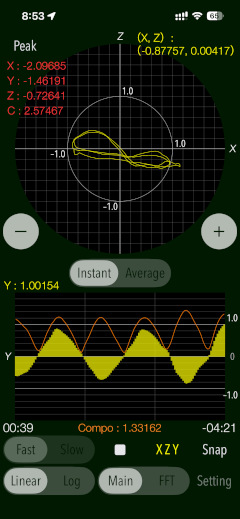
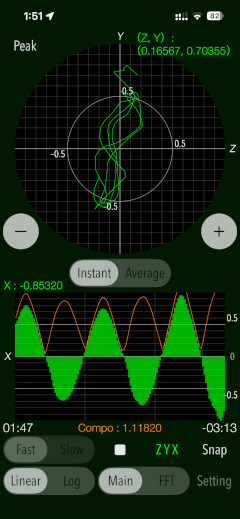
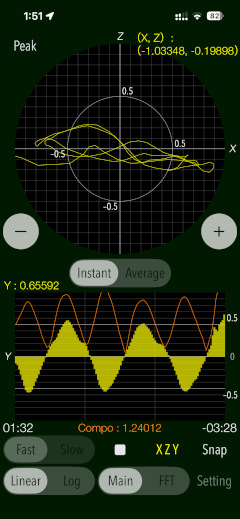
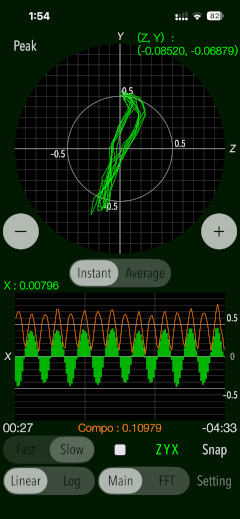
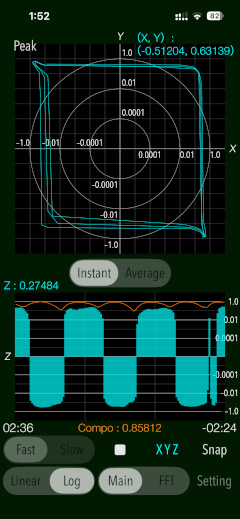
Vibration level measurement displays the effective acceleration value and its maximum value (Peak value).
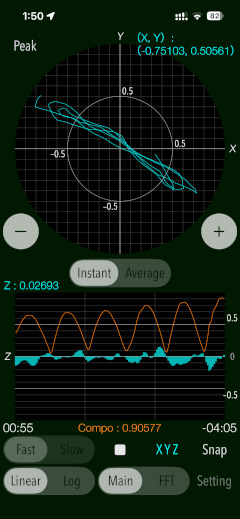
It can be intuitively detected an acceleration amount, that displays the two-axial coordinates in the horizontal direction and the time-axis waveform in the vertical direction. By tapping "peak" button, you can control whether to display numerical value.
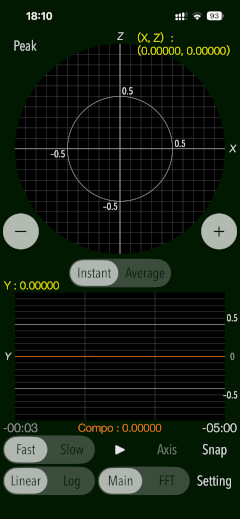
It can be measured by determining the horizontal or vertical direction to suit the attitude of the iPhone. In the two-axis graph display, either the x-y-axis or x-z-axis or y-z-axis by the attitude of the terminal will be displayed. (For this automatic screen display, you need to unlock "Portrait orientation lock" in the iPhone device settings.)
- Axis display setting (Axis)
During measurement operation, tap the "Axis" button to change the axis direction in the graph display. Each time you tap the "Axis" button, the axis direction will be switched sequentially, so please match the axis direction you want to display. In this case, the "Axis" button will be displayed as "XYZ", "XZY", "ZYX", etc., according to the axis direction selection. Note that the "Axis" button is not displayed in logarithmic scale view.
- Switching of acceleration display (Instant/Average): Instant - instantaneous acceleration, Average - average acceleration per second.
- Logarithmic scale display (Log)
This is a display mode to detect minute vibration.
In normal use, the graph does not become stable because the vibration does not converge. Graphing extremely small numbers can be affected by errors due to noise and temperature in the operating environment or time variations in sensor calibration.
In addition, if you move the terminal in the middle of measurement, the sensor correction may be wrong, and the acceleration value may converge to a fixed amount, so it is recommended to stop the measurement and re-measure.
- 3-axis composite acceleration : COMPO
The 3-axis composite acceleration is drawn as an orange line. In "Vibroscope Lite", it is displayed by tapping "Compo" button.
- Sampling period (Configuration measurement speed) : FAST/SLOW
By tapping "slow" or "fast" button, the sampling period of the acceleration sensor is specified. Please set it in accordance with the occurrence tendency and type of the measurement source. It is not possible to switch the sampling period during the measurement. In addition, the sampling period may be influenced by the hardware environment and the operating environment of the iOS system.
- [FAST] : 100Hz (default)
- [SLOW] : 40Hz
- Range of measurement display : + / -
By tapping "+" or "-" button, you can specify the display range of the vibration level measurement. Please be set according to the magnitude of the acceleration of the measurement source.
- [+]: increase the display range.
- [-]: decrease the display range.
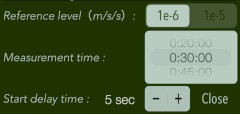
- Measurement Time
This is a timer setting for vibration level measurement. Measurement time can be set from 1 second up to 1 hour.
- Measurement time : 1 second, 5 seconds, 10 seconds, 15 seconds, 30 seconds, 1 minute, 5 minutes, 10 minutes, 15 minutes, 20 minutes, 30 minutes, 45 minutes, 60 minutes
- Start delay time
It can specify the delay time from when you tap the start button to the actual measurement start. Time setting is up to 20 seconds. You can avoid the influence of tap vibration of start button.
- Start delay time : 0 - 20 seconds
- Reference level
It can select the reference level [0 dB] of vibration acceleration from the following reference value in FFT mode.
- Reference Level[1] : 1e-6 [m/s2]
- Reference Level[2] : 1e-5 [m/s2]
- Logging data strings : "Date and time", "X axis acceleration", "Y axis acceleration", "Z axis acceleration"
- Acceleration data unit : m/s2
- Version 10.0 was released on November 19, 2025. UTC
- Version 9.0 was released on November 21, 2024. UTC
- Version 8.0 was released on January 16, 2024. UTC
- Version 7.1 was released on April 22, 2023. UTC
- Version 7.0 was released on April 12, 2023. UTC
- Version 6.1 was released on December 9, 2022. UTC
- Version 6.0 was released on December 7, 2022. UTC
- Version 5.0 was released on February 9, 2022. UTC
- Version 4.3 was released on April 16, 2021. UTC
- Version 4.2 was released on February 11, 2021. UTC
- Version 4.1 was released on November 6, 2020. UTC
- Version 4.0 was released on April 21, 2020. UTC
- Version 3.1 was released on June 20, 2019. UTC
- Version 3.0 was released on December 28, 2018. UTC
- Version 2.0 was released on February 21, 2018. UTC
- Version 1.1 was released on May 5, 2016. UTC
- Version 1.0 was released on September 22, 2015. UTC
- At the time of the first access to Photos after installing the app, you will be asked permission to access them from the iOS system. If you did not enable this setting on this time, it can not be access from the app by privacy restrictions of the iOS. Please enable slide switch of the app in the access permission of the iOS setting, "Settings > Privacy & Security > Photos".
- In addition, in order to to continue the measuring operation in the background, "Settings > General > Auto-Lock" must be set to "Never". Please set this setting if you want to use the data logging.
- The measurement display is automatically set by detecting the orientation of the device at the start of measurement. In order to display in the correct axis direction, you need to unlock "Portrait orientation lock" in the Control Center settings of your iPhone device.
- The xyz axis of the measurement display is based on the spatial axis of the acceleration sensor installed in the iPhone. In this application, 2 axis display coordinates and time axis coordinates are automatically determined by the terminal state.
- State with terminal vertically: 2 axis graph x - z, time axis y
- State with terminal in landscape orientation: 2 axis graph y - z, time axis x
- State with terminal liquid crystal facing the sky: 2 axis graph x - y, time axis z
- Regarding the log data, since it records the data of the acceleration axis xyz itself, it is not related to terminal orientation.
- With respect to measurable frequencies, the data sampling period from the acceleration sensor is Fast 100 Hz, Slow 40 Hz. It may be affected by the hardware environment and operating environment of the iOS system. In the FFT display, the frequency up to 1/2 of the sampling period is analyzed and displayed.
- This application is not recommended for official measurement because there are variations and accuracy errors for each terminal and sensor. Also, if the vibration is large, errors may accumulate and proper display may not be possible. Therefore, please do not guarantee strict measurements, please use as an auxiliary tool to measure daily vibration level.
- Please do not use while driving or operating the machine.
- When measuring for a long time, battery consumption may be large.
- The logarithmic scale graph is displayed very small numerical value, so it may be influenced by noise and temperature error in your environment or time fluctuation of sensor calibration.
- Please fill in your review by accessing from iOS device.
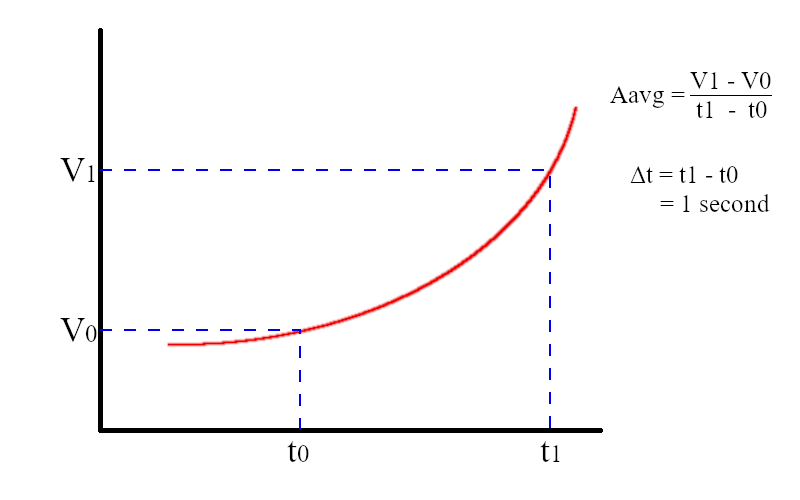
The ability to display average acceleration per second has been added in the latest version. You can toggle between displaying instantaneous acceleration and average acceleration. The default is instantaneous acceleration.
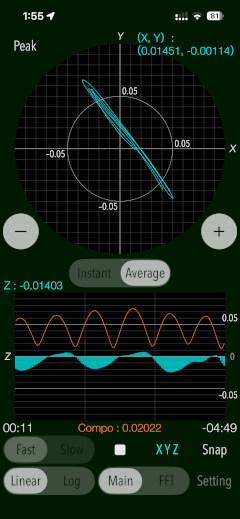
* Method of finding the average acceleration
The instantaneous acceleration is integrated and the velocity is calculated. The average acceleration is obtained by dividing the difference in velocity between two points by the time interval as shown in the figure below. The time interval in this app is set to 1 second.
You can change to logarithmic scale view by tapping "Log" button. To return to the linear scale graph display, tap "Linear" button.
The following functions are applied in common regardless of the selected operation mode.
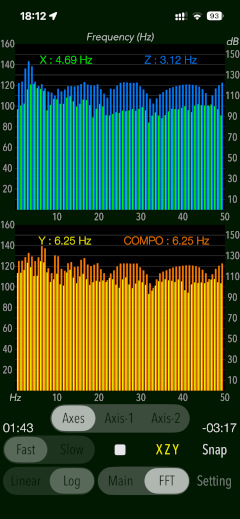
FFT mode
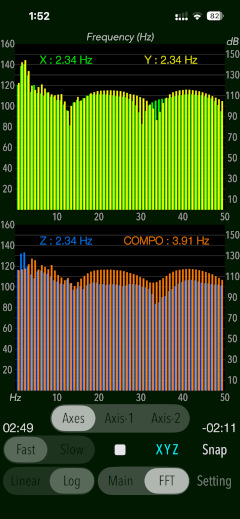
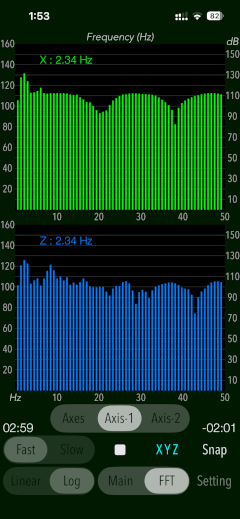
FFT mode displays the frequency analysis results of the Fast Fourier Transform (FFT). FFT analyzer performs frequency spectrum analysis using the 3-axis acceleration (X, Y, Z) and 3-axis composite acceleration (COMPO) as input signals, and is displayed them in real time.
By tapping START button to start the FFT Analysis, and it then stop by tapping STOP button. Measurement parameter settings in MAIN mode will be reflected directly.
During the measurement operation, the FFT graph can be selected from three types of display format (Axes, Axis-1, Axis-2)." By tapping the "Axis" button, the display axis can be selected, and the "Axis" button will display "XYZ", "XZY", "ZYX", etc. according to the axis direction selection.
Measurement Value Display : PEAK
In MAIN mode, tapping the "Peak" button turns the peak measurement value on and off. The peak level hold value during the current measurement is displayed. The 3-axis composite acceleration is displayed as "C".
Common settings : SETTING
By tapping "Setting" button, it displays this common settings for each operational mode.
Snapshot: SNAP
By tapping "Snap" button, you can capture the measured screen image to Camera roll. It will be saved in PNG format.
In addition, the saved the image will be inserted time stamp (date and measured time data).
At the first time, the confirmation of access to the camera roll is required once from iOS system when you press "Snap" button.
Data Logging
Measurement data and time information will be saved as a LOG file. LOG file can be external output using the iPhone file sharing function, so it allows you to data analysis offline. If the location information display is permitted, the location information at the start of measurement will be stored in the logging data.
The LOG file is output in text format with the following data strings:
Log data can be transferred from an iOS device to a Mac or PC using the iTunes File Sharing feature. macOS Catalina and later can share files between an iOS device and a Mac using the Finder. For the information on files sharing between iPhone and PC/iTunes, please refer to the following Apple support site.
Information view
By tapping "Setting" button, it will display the product information and the screen description. The screen description can be scrolled up and down.
Release Note
Precautions
Note
Request for review
Please send a review of your comments and requests for this app. We will use your review to improve our products. Thank you for your cooperation.
Contact us
For inquiries and consultation regarding our iOS app products, please contact the following support desk.
About Inquiries